Jump to Individual Doe Sheet or CDCB Data
Lab Results
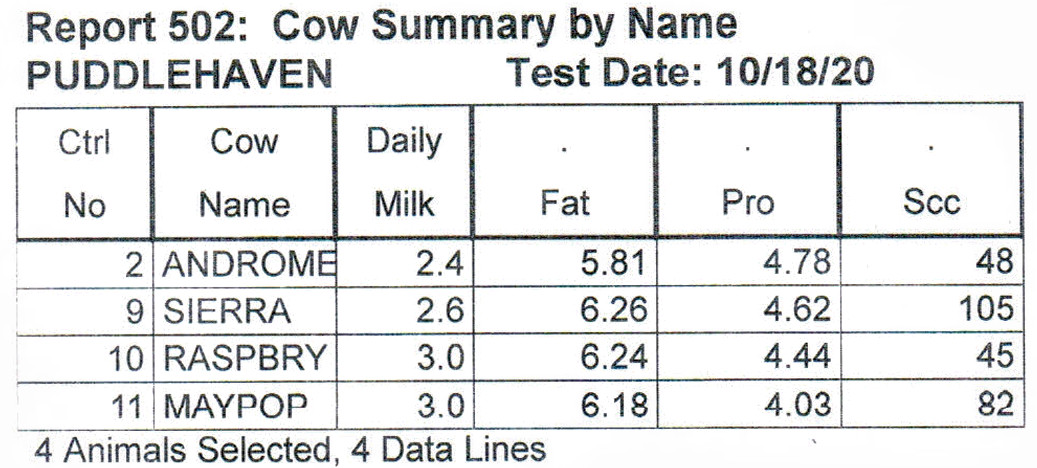
Why does it say "cow" when these are all goats?
Milk test was originally designed for cows and that's the way it remains today. Whether you're testing a goat, sheep, or a camel, all of your paperwork will say "cow".
Ok, so what do all of these numbers mean?
- Ctrl No: The number that identifies this doe in your herd, regardless of what you call her.
- Cow Name: Barn name, restricted to 7 characters.
- Daily Milk: Pounds of milk produced on this test, rounded to the nearest tenth of a pound.
- Fat: Percent butterfat in the milk sample. My lab rounds to the hundredth of a percent but the processing center will round it to the tenth.
- Pro: Percent protein in the milk sample. This number should always be lower than the butterfat percent. If not, it's called a protein inversion and your goat probably has an unhappy rumen.
- SCC: Somatic Cell Count. Add three zeroes to get the total number of somatic cells per milliliter of milk.
Tell me more about SCC!
Somatic cells are basically anything in the milk that isn't milk. It's usually white blood cells but it can also be bits of tissue. Milk will never be completely free of somatic cells but lower numbers are better. Higher numbers can indicate an injury (kids nursing roughly) or an infection (mastitis). Each goat will have her own "normal" SCC count so you just want to pay attention if her count suddenly spikes. Most of my does are usually between 50 and 300.
What about MUN?
I don't get MUN reports so it doesn't show on my lab results, but it is an option at many labs. MUN stands for "Milk Urea Nitrogen". Nitrogen in urea (found in bodily fluids such as blood and milk) is a result of the breakdown of protein. Anything not absorbed and used by the body will be expelled and can be measured. If a doe's MUN levels are low, increasing the protein in her diet should incrdease her milk production. If a doe's MUN levels are high, she isn't using all the protein she is being fed - it's being wasted. You might want to switch to a lower protein feed. Just like SCC, each doe has her own baseline so you are looking for fluctuations. Anecdotally, values of 25-35 seem to be common.
Your lab will send your milk test data to your processing center so they can do their magic (algorithms) and estimate how much your does produce between tests. I use Amelicor. Data sheets from other processing centers will look different but should have all the same information. Let's take a closer look at each section!
Top of the Sheet

Left Side: "IC" is "Individual Cow" but it's nice they recognize this is a doe in the next box. Everything over here is basic info just identifying the herd (Puddlehaven; 91-90-0107), the test type (OS-40), the control number of the doe (2), the date this herd last had a milk test (2-21-21), and the date the samples were processed (2-24-21).
Right Side: Sire (Debonaire), Dam (Star), and the doe this sheet is about (Andromeda) with their breed (RD for Registered Dwarf) and registration number. If they have milk test data, either their own or estimated from relatives, their most recent PTA will show up here. PTAs are calculated in August and December.
- PTA: Predicted Transmitting Ability. 0 is the average for the breed. Positive numbers indicate this goat should pass on higher than average values of this trait to its offspring.
- MLK: Pounds of milk over a complete lactation (compared to the breed average)
- FAT: Pounds of fat over a complete lactation (compared to the breed average); %fat (compared to the breed average)
- PRO: Pounds of protein over a complete lactation (compared to the breed average); %protein (compared to the breed average)
- MFP$: Milk Fat Protein Dollars - The combined value of pounds of milk, pounds of fat, and pounds of protein in the current cow milk market. Compared to the breed average. The percent is a breed ranking. From 0 (lowest producers on milk test) to 100 (highest producers on milk test), Andromeda is ranked in the 27th percentile.
Test Day and Lactation Data
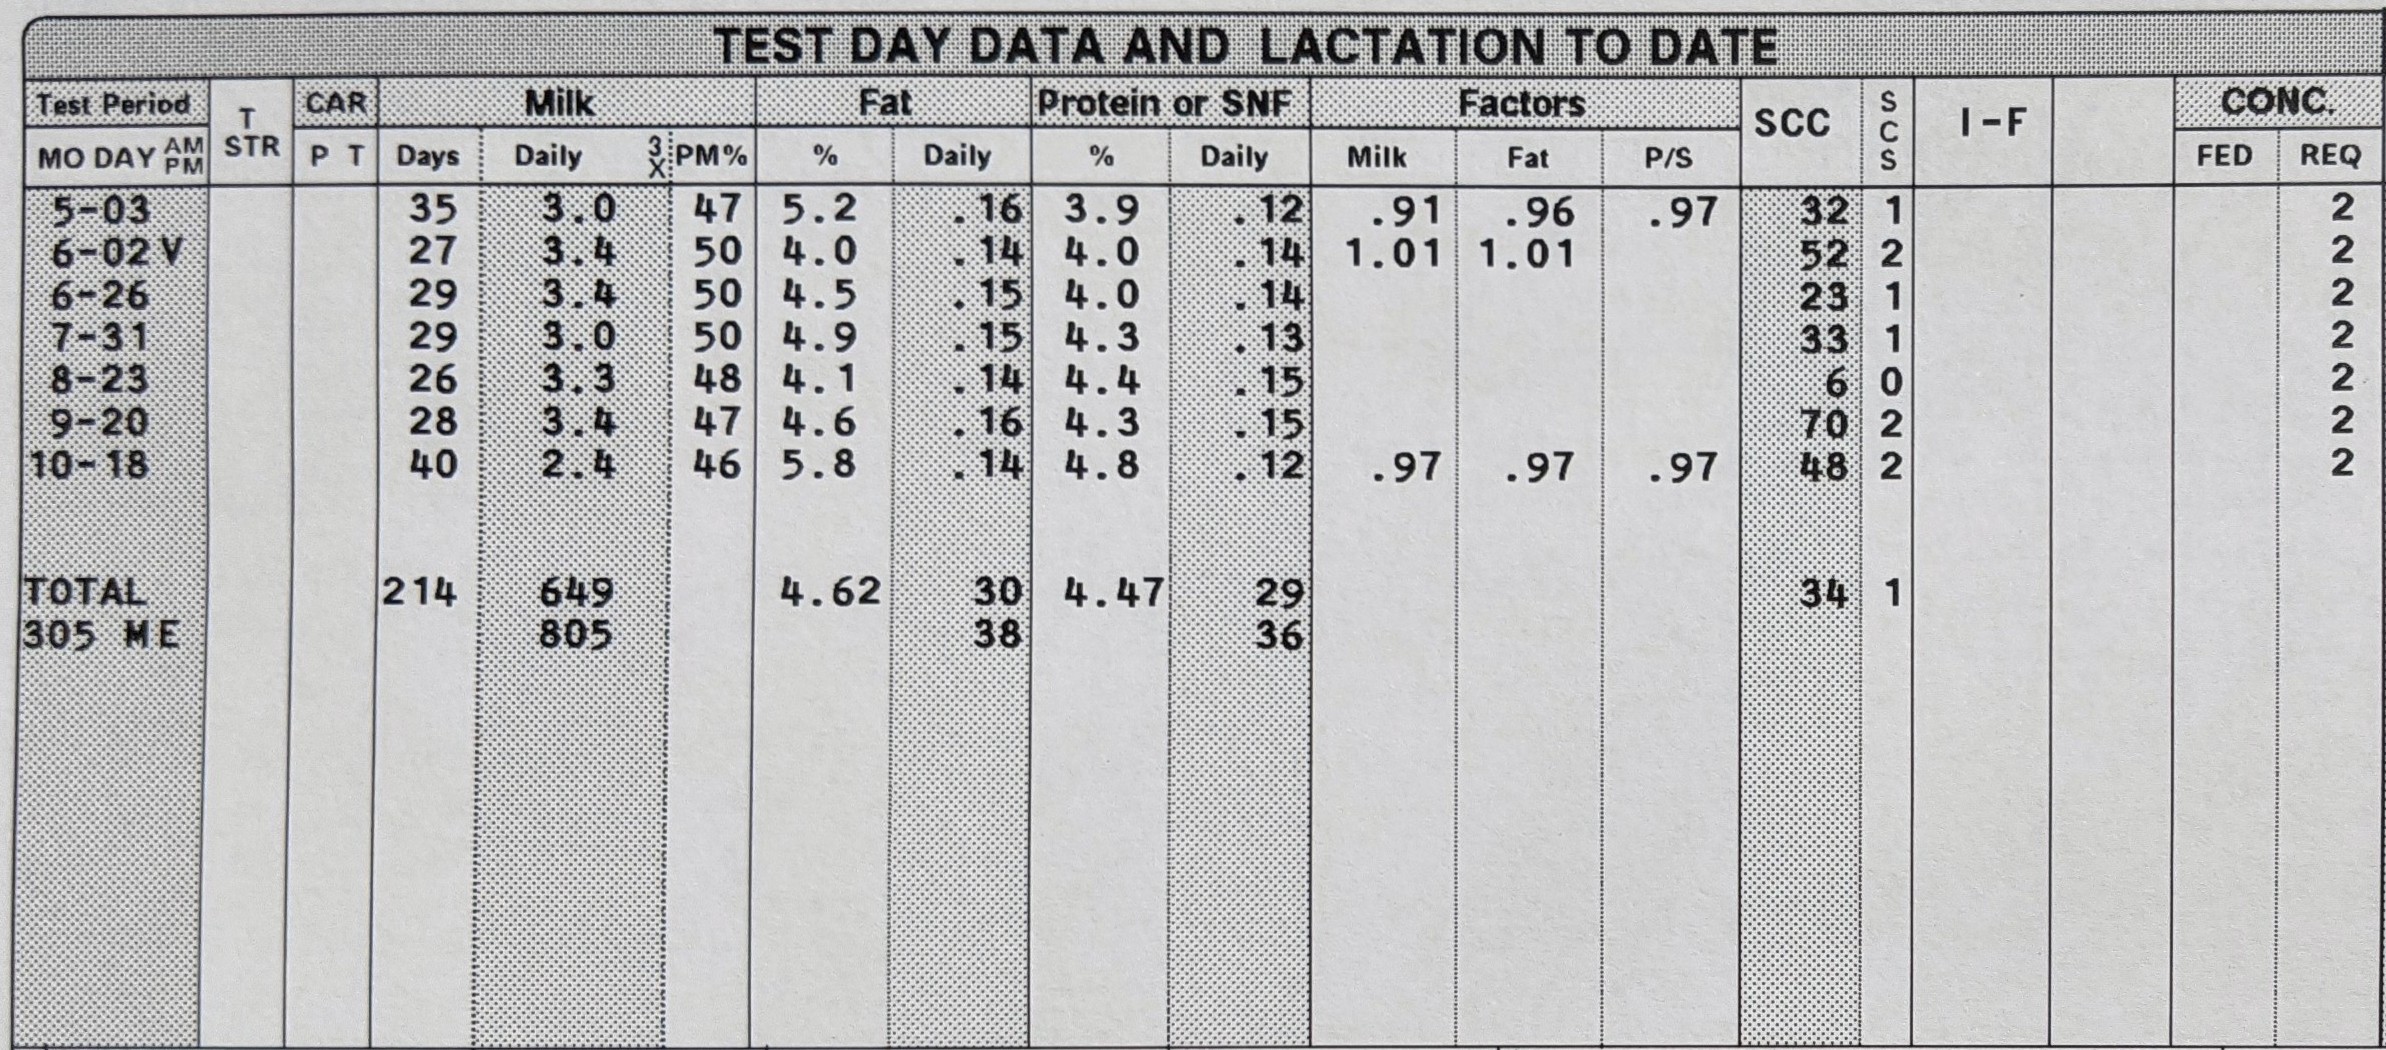
Test Day: The date of each test is noted, along with a "V" if it was a verification test.
- Days: Days in milk on test day
- Daily: Pounds of milk
- PM%: How the PM milking compared to the AM milking. If it's 50, the weights were equal.
- Fat%: Butterfat percentage
- Fat Daily: Pounds of fat (pounds of milk x butterfat percentage)
- Protein%: Protein percentage
- Protein Daily: Pounds of protein (pounds of milk x protein percentage)
- Factors: I don't actually understand this one. Please let me know if you do!
- SCC: Somatic Cell Count
- SCS: Somatic Cell Score - SCC values are divided into 10 categories from 0 to 9. Each category is double the one before it. Lower numbers are better!
Total: Total days in milk, pounds of milk, average fat percentage, pounds of fat, average protein percentage, pounds of protein, average SCC, average SCS.
305 ME: Mature Equivalent
- Records that are standardized for days in milk (305), twice-a-day milking, freshening between January and March, and a mature age of 36 months.
- This is an easy way to compare does of different ages who may or may not have been milked for a full 305 day lactation.
- Based on the data from this lactation, if Andromeda were 36 months (3 years) old and milked twice a day for 305 days she would be expected to produce 805 pounds of milk, 38 pounds of fat, and 36 pounds of protein.
Comparisons
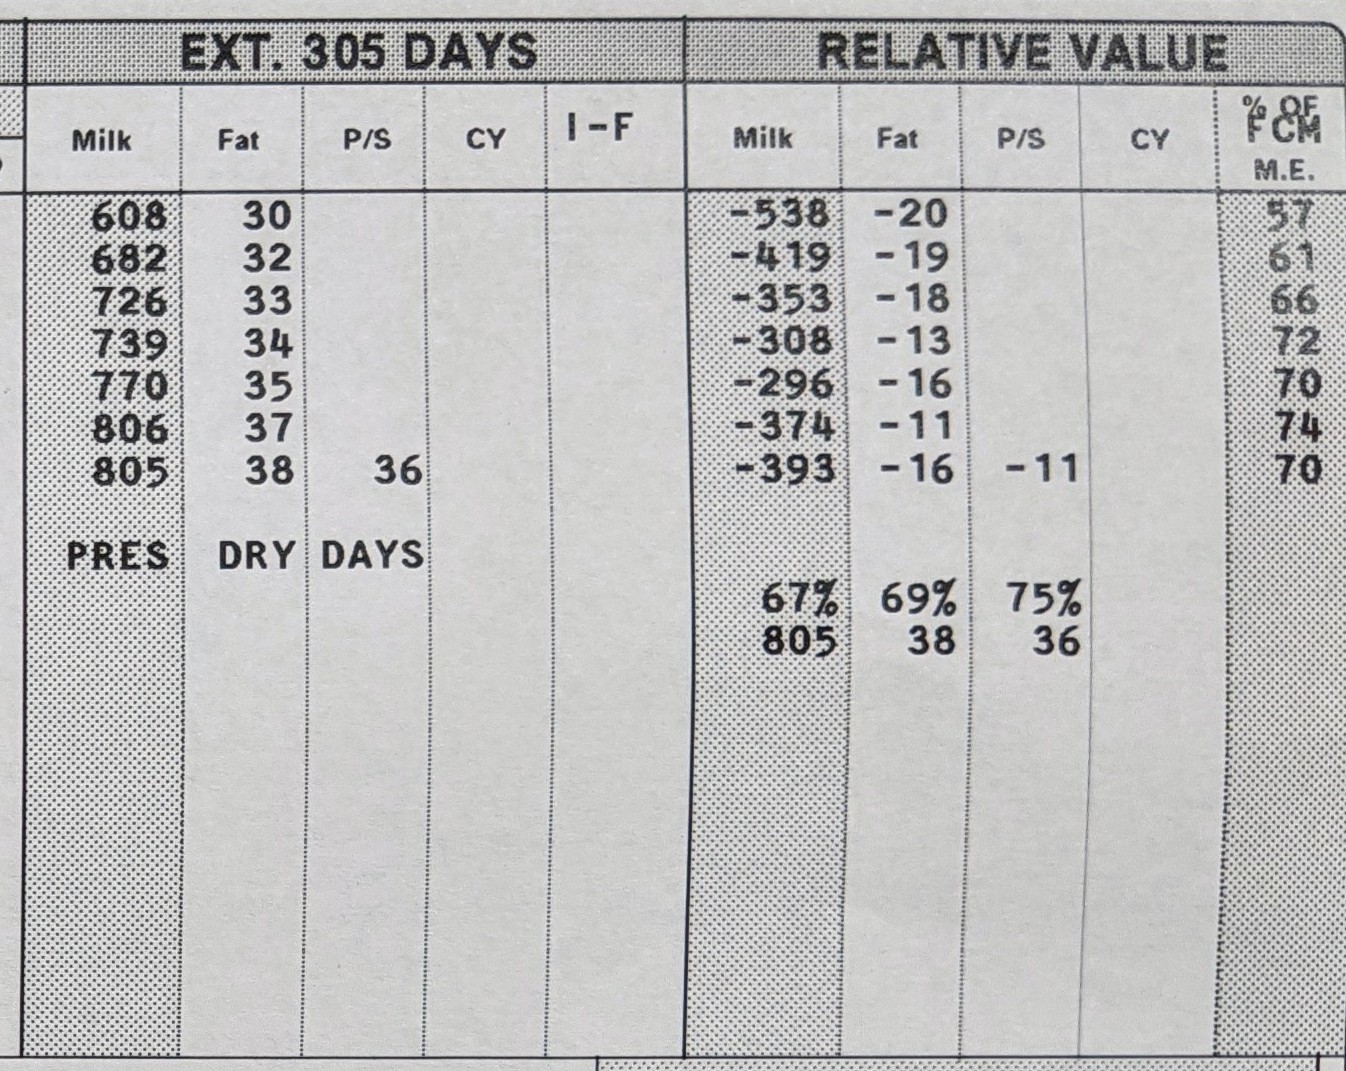
EXT. 305 Days: The predicted pounds of milk, fat, and protein for this lactation, updated on each test day.
- Andromeda's numbers keep going up with each test because she has a low peak early in her lactation and holds steady or even increases production near the end of a lactation when most models assume a goat's production would be tapering off.
- "PRES DRY DAYS" just means Andromeda was not in milk when this sheet was produced for my herd's most recent milk test.
Relative Value: How this doe's estimated 305 Day ME compares to the rest of her herd.
- Milk: How many pounds from average for this herd (at different points in her lactation, the model predicts she would produce 300 to 500 pounds less a year than the average doe in my herd)
- Fat: How many pounds of fat from average for this herd
- P/S: How many pounds of protein from average for this herd
- % of FCM M.E.: Fat Corrected Milk (FCM) combines volume and butterfat percentage into one number to make it easier to compare does. The numbers reported here show the percentage of her own Mature Equivalent (ME) she is estimated to be producing. How this lactation compares to her "ideal" lactation. This lactation at 4 years old was 70% of what she was estimated to produce at 3 years old.
- The percentages near the bottom are what percent of my herd average she was estimated to produce in pounds of milk, fat, and protein. The average producer in my herd would score 100%
- The numbers at the bottom are her 305 Day ME for this lactation.
Bottom of the Sheet

Top Box: General information about this lactation
- Left Side: Age at kidding; Birth date and Kidding date; Lactation number and Number of days dry between this lactation and the previous one; Days since she last kidded; Number and sex of kids (oops, this info is missing!)
- Right Side: Notable events. In this case, she was marked dry on 11-14-20.
Middle Box: Data from previous lactations
- The first section shows which test type she was on (OS-40), which lactation number, when she kidded, and the age she was at kidding.
- The second section shows what she produced up to 305 days.
- The third section shows the estimates of her 305 Day Mature Equivalent for each lactation.
- The fourth section shows how her ME estimates compared to the rest of her herd for each lactation. Her first year on test it was just Nigerians. The second year I added Mini-LaManchas. Big difference!
- The fifth section shows the days in milk and what she produced on each lactation.
- The last section shows how many kids of each sex she had on each lactation and the name of the sire. That info is missing for her most recent lactation. I need to contact my DHIA to get that fixed!
Bottom Box: Lifetime values
- Andromeda has an "Incomplete" down here because she's missing information. I need to fix that!
- The first box should show how many days of her life she has been in milk and/or pregnant and what she produced each day she was in milk (on average).
- The second box shows the average values for her 305 Day ME across all lactations.
- The third box shows the average values of how she compared to the rest of her herd across all lactations.
- The fourth box shows how many days she has been in milk and what she has produced in her lifetime (so far).
If the goat is registered with ADGA, there is a quick and easy way to access this data! Go to ADGA Genetics and lookup the goat by name or registration number:

Click on "CDCB Data" on the left side of the goat's page:
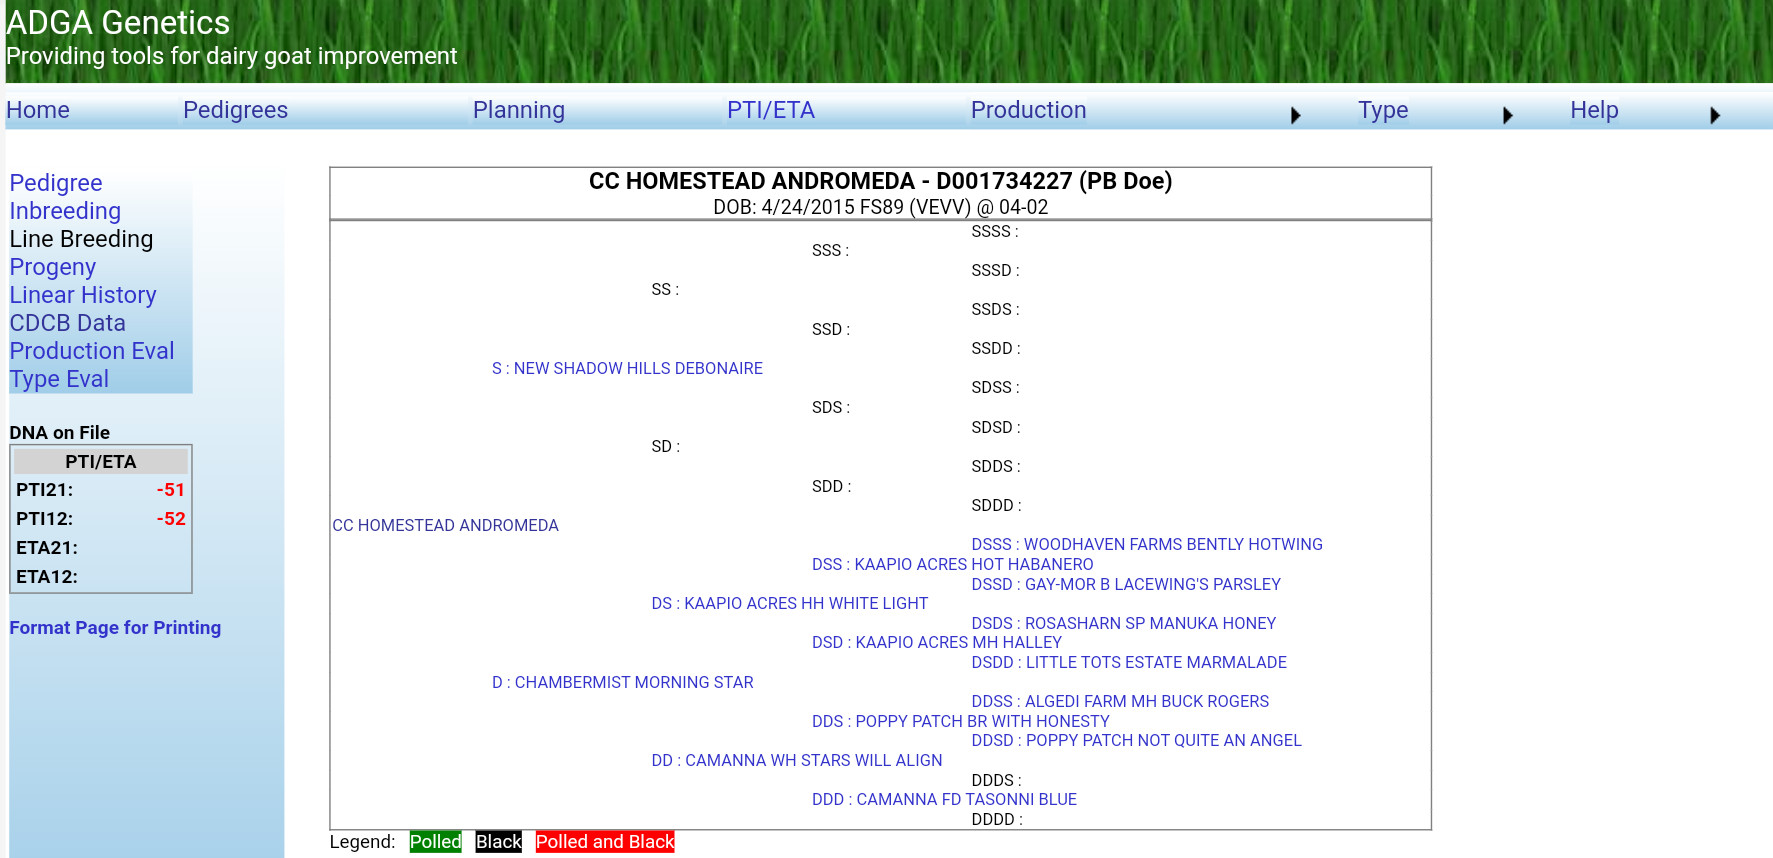
The first time you use this link you will have to sign up for a free account with CDCB. When that is accomplished, go back to the ADGA Genetics page and click the "CDCB Data" link again.
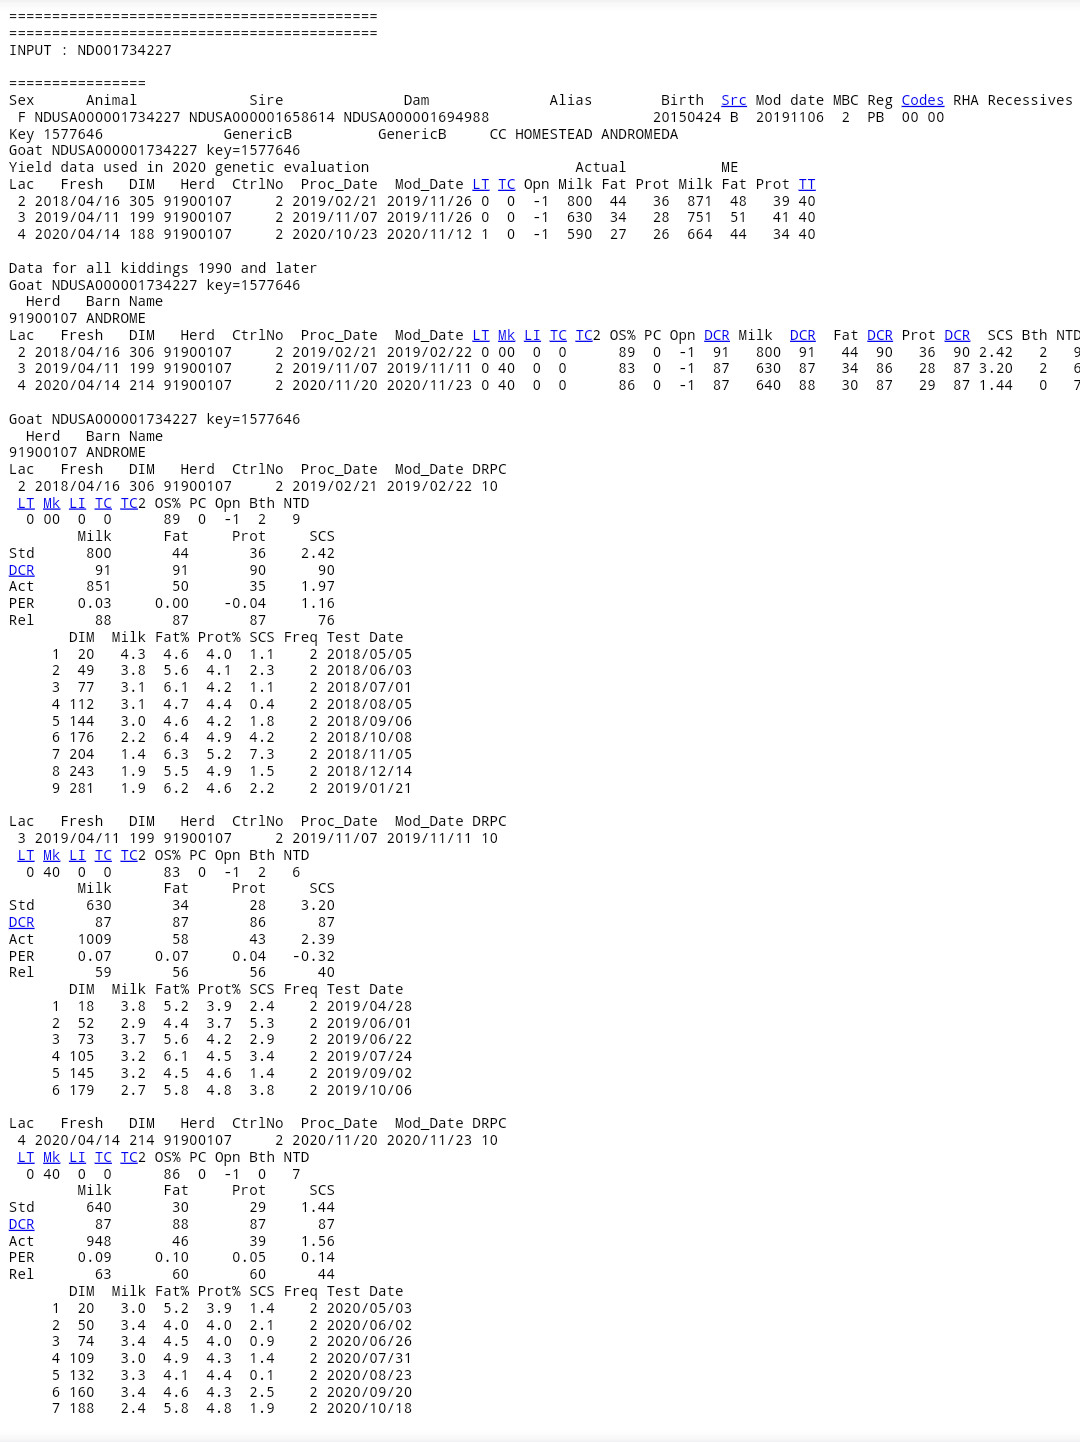
Let's take a closer look at each section!
Top of the Page

The top few lines show the breed (ND) and registration number of the goat and its parents, the name of the goat, and its date of birth.
Yield data used in 2020 genetic evaluation: All the data they had on file the last time PTAs were updated. This happens twice a year in August and December. Only the first 305 days of a lactation are used in genetic evaluations.
- Lac: Lactation number
- Fresh: Kidding date
- DIM: Days in Milk
- Herd: Herd code of the herd she was in for each lactation.
- CtrlNo: Control number used to identify her within that herd
- Proc_Date: The most recent date data was received from the lab for this lactation.
- Mod_Date: The most recent date data was updated for this lactation.
- LT: Lactation Type Code. 0 means completed lactation, 1 means lactation in progress.
- TC: Termination Code. 0 means lactation is in progress or it ended normally. There are other codes if the doe had health issues or was sold.
- Opn: Days Open. -1 means they don't have any information to put here.
- Actual: The pounds of milk, fat, and protein this doe produced on each lactation.
- ME: The pounds of milk, fat, and protein this doe is estimated to produce as a 3 year old (Mature Equivalent), based on just the data from this lactation.
- TT: Test Type (in this case, owner sampler)
Data for all kiddings 1990 and later: All the data they have on file for each lactation, including lactations longer than 305 days.
- Mk: Lactation Mask Code. 00 means nothing. 40 means the record is coded with previous days dry.
- LI: Lactation Initiation Code. 0 is normal, there are codes for abortions and precocious udders.
- OS%: Percentage of test days that were owner sampler (unsupervised)
- PC: Pregnancy Confirmation Code. 0 means no data. 1 is pregnant, 2 is not pregnant.
- DCR: Data Collection Rating. This is an indication of the accuracy of the lactation records. Frequency of testing, the closeness of estimated and actual amounts, and the amount of supervision are factors. The highest rating owner sampler can get is 75 but a verification test can bump that score up into the 90s.
- SCS: Somatic Cell Score. SCC values are divided into 10 categories from 0 to 9. Each category is double the one before it. Lower numbers are better!
- Bth: Birth Code. 0=missing information 1=single, 2=multiples, 3=embryo transfer
- NTD: Number of Test Days in this lactation
Bottom of the Page
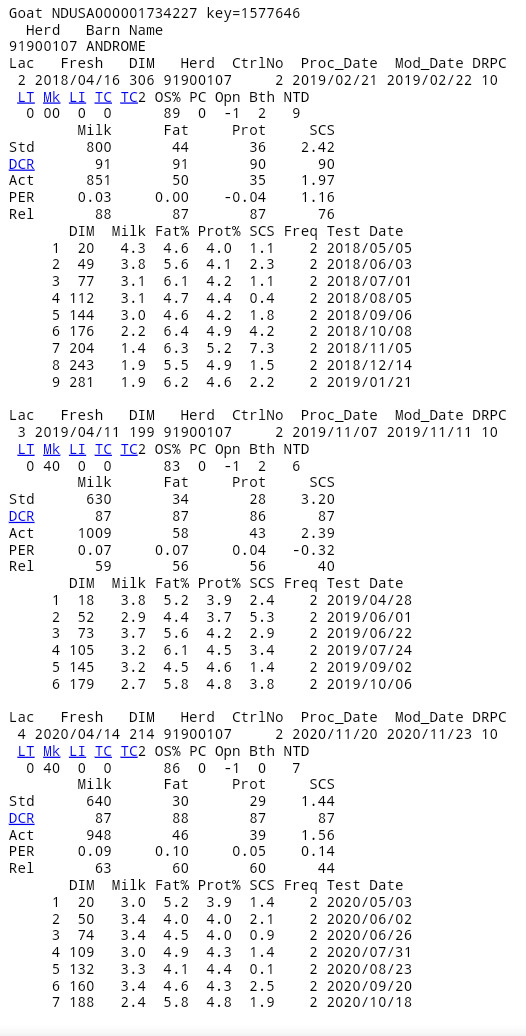
All the data for each lactation! I won't explain what has already been explained above but here is what's different:
- DRPC: Dairy Records Processing Center. 10=Amelicor, 07=DRMS
- Std: Status to Date. What the doe produced during this lactation
- Act: Actual. What the doe is predicted to produce on this lactation if she is in milk for 305 days. No, this is not a typo. "Actual"=Projected
- PER: Persistency. The rate of change in production between tests.
- Rel: Reliability. The percent chance the next lactation will be within one standard deviation of this one.
Links
